I’ve noticed recently that there’s been some doubt over the accuracy of RTrack’s site-wide stat estimate releases, such as total player count (visible on the homepage), monthly active users and monthly engagement hours. I try to use methods that estimate these figures as accurately as possible, and I only release figures when I’m confident in their validity. Testament to this is the lack of a February 2020 MAU release – which wasn’t made due to a sampling bug that ended up meaning the sample size was much smaller than it should’ve been. That stat was never released because I wasn’t confident that it was accurate enough.
It’s important to remember that RTrack’s releases are not official Roblox figures, and shouldn’t be treated as such. In this article I’ll take a look at past official Roblox press releases, and compare them to RTrack’s own recordings for the same time periods to see what the difference is and how close RTrack has been to the real figures. This article will be split into three parts, one for each type of site-wide stat RTrack releases.
Real time site-wide player count
How it’s calculated
RTrack tracks the entire Roblox ‘Popular’ sort once every minute, which is usually close to 10,000 games, and contains almost every game on the platform with players. The site-wide player count shown on the landing page is the sum of the player count of every game, and updates once per minute.
How accurate is it?
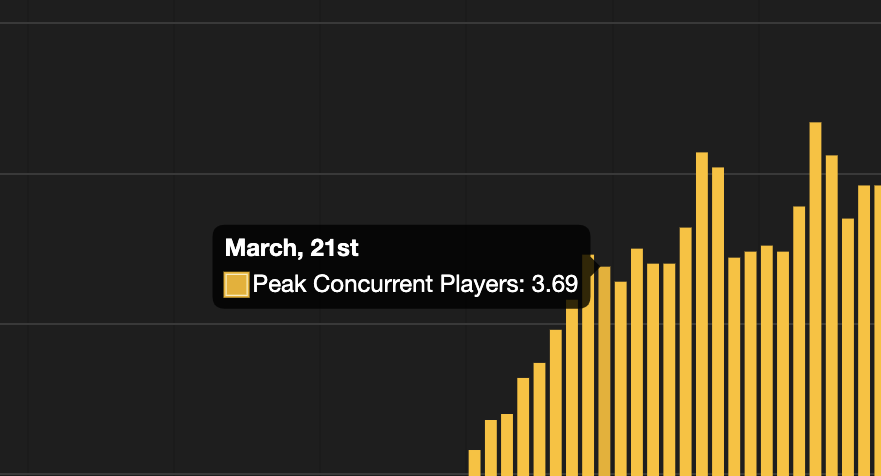
Well, let’s compare some past RTrack figures and some Roblox releases. A good day to look at is the 7th Annual bloxy awards, which happened on the 21st March this year. RTrack keeps a record of player count for every minute recorded, going back to December 2019, and player count data can be seen on the RTrack Platform page (for complete users). Let’s take a look at what RTrack said was the peak concurrent player count on the 21st March;

As you can see, RTrack puts peak concurrent players for the 21st March at 3.69M. It was widely reported that Roblox had a peak player count for the Bloxys of 600,000 and nearly 4 million concurrent players.
If adjusted for timezones (the 21st March in PST, rather than UTC, RTrack’s default time) the peak for the 21st measured by RTrack is actually 3.73M, which could definitely be described as ‘nearly 4 million’ concurrent players.
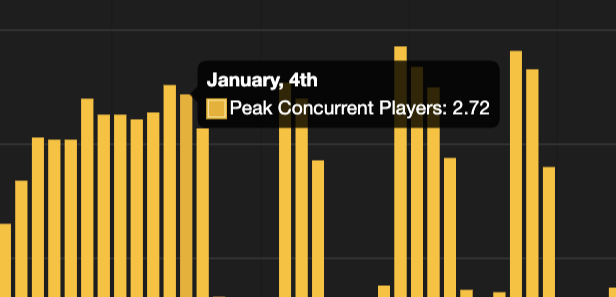
Articles posted in early 2020 generally cited the peak Roblox player count at 2.7 Million, and looking at the wayback machine for corp.roblox.com on January 4th, we can see that their peak concurrent player count was cited at 2.7 Million. This is consistent with what RTrack recorded for that time period;

The Verdict
History has shown that RTrack’s platform wide player count is generally accurate, being very close to the released values in both cited cases.
Monthly active users
How it’s calculated
Transparency in the methodology used to estimate MAU has always been important to me. On every MAU article since the first one in December 2019, there has been a section titled ‘Methodology’ which includes a brief description of how MAU is calculated and even some specific information on that specific month’s sampling.
For each MAU reading, 40,000-80,000 Roblox accounts are selected at random from the 1.7bn+ accounts on Roblox. This is repeated multiple times with different sample groups to ensure the result is reflective of the platform as a whole at that time, and to weed out anomalies.
How accurate is it?
Let’s first take a look at RTrack’s past MAU figures, here’s an interactive graph:
There aren’t many releases of Roblox Monthly Active users, and it’s not listed on corp.roblox.com. I did, however, find this release from February 2020 saying that Roblox had “recently reached 115 million monthly active users and more than 1.5 billion hours of monthly engagement“. This could be referring to either December 2019 or to January 2020, but both of RTrack’s estimates for around that time aren’t far off.
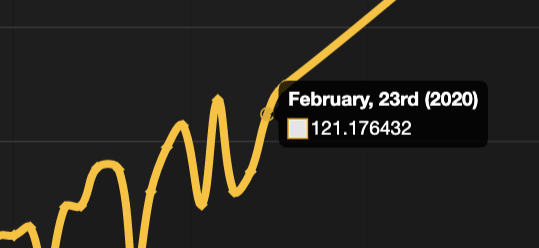
There was a second release on March 23rd concerning the 7th Annual Bloxy awards, releasing another figure; “Roblox, a global online platform bringing more than 120 million people together through play…”, although no MAU report was made for February, rolling 30 day active user counts are available through RTrack platform (which shows the same figures as those shown in MAU reports). The closest to February MAU available is the 30 day rolling average prior to February 23rd, recorded by RTrack at 121M:
Regrettably no reliable monthly active user data was recorded between February 23rd, and March 20th, which appears to be a key time where player count rapidly increased following lockdown measures. Nonetheless, RTrack’s January MAU report (119M) and the 30 day rolling average from February 23rd (121M) are both within 1 Million of the figure released by Roblox, which is pretty good in my books.
The Verdict
Though history has shown RTrack’s MAU reports to be reasonably accurate, I would certainly suggest taking these figures with a pinch of salt. They have so far been great at showing the trend in active users, but until there is further evidence on this, assume that MAU figures could be a few million off the real figure.
Monthly engagement hours
How it’s calculated
Engagement hours are a relatively new release from RTrack, having only been published on the blog once, though data for this and weekly engagement hours is available from RTrack Platform going all the way back to December 2019. The methodology for how engagement hours are calculated has not been released, and for the sake of preventing others copying my system for this, I won’t be explaining it here. Suffice to say, the calculation uses data that only RTrack records (as far as I’m aware).
How accurate is it?
Here’s the interactive graph for monthly engagement hours, going back to December 2019:
Luckily, Roblox publishes this data on corp.roblox.com, so we can use the WaybackMachine to check it’s validity. Let’s start by looking at the figure shown on the site for monthly engagement hours between January 2020 and April 2020. For this duration, the site displayed monthly engagement hours at 1.2 billion:

This matches up almost 1:1 with RTrack’s figures for the same period, and since the figure shown on the site was not changed/increased, it’s likely that as RTrack estimates, total engagement hours fell in January and February.
The next time the site was edited was June 2020, when the figures were changed to show 2.5bn total engagement hours each month.

Annoyingly here, RTrack’s data does not exactly follow Roblox’s. While others appear to corroborate RTrack’s estimates up to April, something seems to have gone wrong with the figure for May 2020. This was almost definitely caused by the RTrack outages through May, leaving the algorithm to attempt to fill in the gaps between May 11th – May 16th, and May 20th – May 27th. I’m still very proud of my system for producing a figure that is still not too far off from the official one, despite missing 12 days of data, but in this case the figure was not entirely accurate.
The Verdict
Generally, the methodology used to calculate engagement hours is reliable and accurate, however it relies on RTrack having full uptime, which didn’t happen in May and resulted in a bad figure. From this point onwards I will always include a disclaimer if RTrack has had any outages during that month when releasing engagement figures.

Leave a Reply